Example: Compare Ground Measurements with CAMS CRS Satellite Data#
This notebook loads one BSRN station-month via :class:~bsrn.dataset.BSRNDataset, runs the recommended pipeline (solpos → clear_sky REST2 / MERRA-2 HF → qc_test → qc_mask), adds CAMS CRS all-sky columns from Hugging Face, time-averages with :meth:~bsrn.dataset.BSRNDataset.average, and plots a calendar comparison.
[1]:
import os

import bsrn
from bsrn.io.crs import add_crs_columns
from bsrn.visualization import plot_calendar
1. Input path#
[2]:
INPUT_FILE = "/Volumes/Macintosh Research/Data/bsrn-qc/data/QIQ/qiq0824.dat.gz"

print(f"--- Processing {INPUT_FILE} ---")

if not os.path.exists(INPUT_FILE):
    raise FileNotFoundError(f"File not found: {INPUT_FILE}")
--- Processing /Volumes/Macintosh Research/Data/bsrn-qc/data/QIQ/qiq0824.dat.gz ---
2. Load validated station-month and run the pipeline#
BSRNDataset.from_file loads LR0100 plus metadata. Then solpos, clear_sky(model='rest2'), qc_test, and qc_mask update the cached frame in place.
[3]:
ds = bsrn.BSRNDataset.from_file(INPUT_FILE)
print(f"Station {ds.station_code}: loaded {len(ds.data())} rows.")

# Pipeline: geometry, REST2 clear-sky, QC flags, then mask failures
print("solpos() …")
ds.solpos()
print("clear_sky(model='rest2') …")
ds.clear_sky(model="rest2")
print("qc_test() …")
ds.qc_test()
print("qc_mask() …")
ds.qc_mask()
Station QIQ: loaded 44640 rows.
solpos() …
clear_sky(model='rest2') …
Fetching MERRA-2 from Hugging Face: qiq/qiq0824_merra2.parquet
qc_test() …
qc_mask() …
[3]:
| ghi | bni | dhi | lwd | temp | rh | pressure | zenith | apparent_zenith | azimuth | bni_extra | ghi_extra | ghi_clear | bni_clear | dhi_clear | lwd_clear | |
|---|---|---|---|---|---|---|---|---|---|---|---|---|---|---|---|---|
| 2024-08-01 00:00:00+00:00 | 105.0 | 0.0 | 106.0 | 421.0 | 25.2 | 70.0 | 981.0 | 54.881 | 54.857 | 102.414 | 1320.650 | 759.739 | 507.439814 | 664.498840 | 125.169227 | 410.715619 |
| 2024-08-01 00:01:00+00:00 | 108.0 | 0.0 | 109.0 | 422.0 | 25.2 | 71.0 | 981.0 | 54.717 | 54.694 | 102.625 | 1320.650 | 762.828 | 509.994881 | 665.753119 | 125.445597 | 411.548727 |
| 2024-08-01 00:02:00+00:00 | 112.0 | 0.0 | 113.0 | 421.0 | 25.2 | 70.0 | 981.0 | 54.553 | 54.530 | 102.836 | 1320.650 | 765.910 | 512.545982 | 666.998615 | 125.720382 | 410.715619 |
| 2024-08-01 00:03:00+00:00 | 113.0 | 0.0 | 114.0 | 421.0 | 25.2 | 70.0 | 981.0 | 54.390 | 54.367 | 103.049 | 1320.650 | 768.968 | 515.077560 | 668.227890 | 125.991932 | 410.715619 |
| 2024-08-01 00:04:00+00:00 | 116.0 | 0.0 | 117.0 | 421.0 | 25.2 | 71.0 | 981.0 | 54.226 | 54.204 | 103.261 | 1320.650 | 772.038 | 517.620641 | 669.456101 | 126.263590 | 411.548727 |
| ... | ... | ... | ... | ... | ... | ... | ... | ... | ... | ... | ... | ... | ... | ... | ... | ... |
| 2024-08-31 23:55:00+00:00 | 123.0 | 0.0 | 123.0 | 371.0 | 21.9 | 45.0 | 988.0 | 61.982 | 61.951 | 110.304 | 1335.838 | 627.508 | 430.077633 | 741.828764 | 81.604368 | 359.041392 |
| 2024-08-31 23:56:00+00:00 | 129.0 | 0.0 | 130.0 | 370.0 | 21.9 | 45.0 | 988.0 | 61.825 | 61.794 | 110.521 | 1335.838 | 630.737 | 432.754922 | 743.268714 | 81.808573 | 359.041392 |
| 2024-08-31 23:57:00+00:00 | 135.0 | 0.0 | 136.0 | 370.0 | 21.9 | 46.0 | 988.0 | 61.668 | 61.637 | 110.738 | 1335.838 | 633.962 | 435.429929 | 744.697256 | 82.011590 | 360.170497 |
| 2024-08-31 23:58:00+00:00 | 138.0 | 0.0 | 139.0 | 370.0 | 21.9 | 47.0 | 988.0 | 61.511 | 61.481 | 110.956 | 1335.838 | 637.181 | 438.102614 | 746.114514 | 82.213429 | 361.278756 |
| 2024-08-31 23:59:00+00:00 | 141.0 | 0.0 | 142.0 | 371.0 | 21.9 | 46.0 | 988.0 | 61.354 | 61.324 | 111.174 | 1335.838 | 640.396 | 440.772936 | 747.520613 | 82.414101 | 360.170497 |
44640 rows × 16 columns
3. CRS all-sky columns and time averaging#
Add 1-minute CRS from Hugging Face before averaging. ds.average uses centered windows and replaces the cache with the averaged frame.
[4]:
print("add_crs_columns (Hugging Face) …")
add_crs_columns(ds.data(), station_code=ds.station_code)

print("average(freq='30min', alignment='center') …")
df_avg = ds.average(
    "30min",
    alignment="center",
    match_ceiling_labels=True,
)

print("\nProcessing complete. Sample averaged data:")
print(df_avg[["ghi", "ghi_clear", "ghi_crs"]].head())
add_crs_columns (Hugging Face) …
Fetching CRS from Hugging Face: qiq/qiq0824_crs.parquet
average(freq='30min', alignment='center') …

Processing complete. Sample averaged data:
                                  ghi   ghi_clear   ghi_crs
2024-08-01 00:30:00+00:00  181.666667  582.063900  200.3826
2024-08-01 01:00:00+00:00  456.650000  648.930252  420.4916
2024-08-01 01:30:00+00:00  356.782609  707.238474  414.9592
2024-08-01 02:00:00+00:00  291.666667  755.752768  392.6008
2024-08-01 02:30:00+00:00  295.133333  793.024248  375.5578
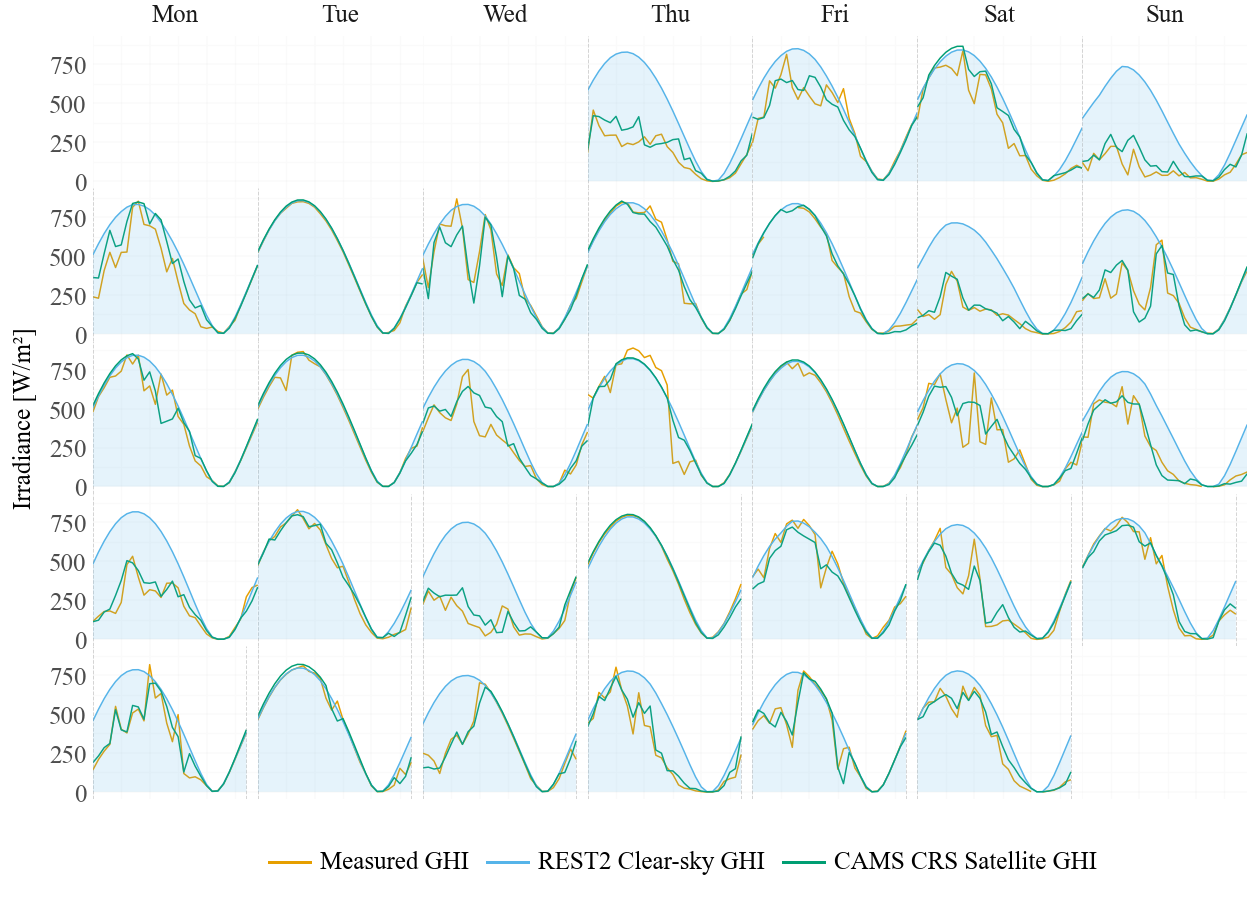
4. Calendar plot#
[5]:
# Calendar helper expects floor-aligned labels for this workflow.
# Use output_file=None to show the figure in the notebook (no PDF).
p = plot_calendar(
    df=df_avg,
    output_file=None,
    meas_col="ghi",
    clear_col="ghi_clear",
    other_cols=["ghi_crs"],
    labels=[
        "Measured GHI",
        "REST2 Clear-sky GHI",
        "CAMS CRS Satellite GHI",
    ],
)
p
/Volumes/Macintosh Research/Data/bsrn-qc/src/bsrn/visualization/calendar.py:87: UserWarning: Automatically sliced input DataFrame to target month: 2024-08
[5]: