Quality control, step by step (QIQ March)#
We load one month of BSRN station-to-archive data with :class:~bsrn.dataset.BSRNDataset, then walk through quality-control checks. The cells below set the file path; §2 opens it with BSRNDataset.from_file.
1. File for :class:~bsrn.dataset.BSRNDataset#
Point INPUT_FILE at a monthly {ccc}{MM}{YY}.dat.gz archive (here QIQ March 2024). The next code cell imports BSRNDataset and prints the default column names (via the internal *_VAR_MAP helpers used by :meth:~bsrn.dataset.BSRNDataset.data).
[1]:
from bsrn import BSRNDataset
from bsrn.dataset import _LR0100_VAR_MAP, _LR0300_VAR_MAP, _LR4000_VAR_MAP

# Change the path here
INPUT_FILE = "/Volumes/Macintosh Research/Data/bsrn-qc/data/QIQ/qiq0324.dat.gz"

# Columns in the dataset
print("LR0100 (default):", list(_LR0100_VAR_MAP.values()))
print("LR0300 (include=['lr0300']):", list(_LR0300_VAR_MAP.values()))
print("LR4000 (include=['lr4000']):", list(_LR4000_VAR_MAP.values()))
LR0100 (default): ['ghi', 'bni', 'dhi', 'lwd', 'temp', 'rh', 'pressure']
LR0300 (include=['lr0300']): ['swu', 'lwu', 'net']
LR4000 (include=['lr4000']): ['dt1d', 'dt2d', 'dt3d', 'btd', 'dt1u', 'dt2u', 'dt3u', 'btu']
2. Load data#
[2]:
ds = BSRNDataset.from_file(INPUT_FILE)

# print metadata about the dataset
print(f"Station : {ds.station_code} ({ds.station_name})")
print(f"Lat/Lon : {ds.lat}, {ds.lon}")
print(f"Elev    : {ds.elev} m")
print(f"Res     : {ds.resolution} min")

# print the first 5 rows of the data
ds.data().head()
Station : QIQ (Qiqihar)
Lat/Lon : 47.7957, 124.4852
Elev    : 170.0 m
Res     : 1 min
[2]:
| ghi | bni | dhi | lwd | temp | rh | pressure | |
|---|---|---|---|---|---|---|---|
| 2024-03-01 00:00:00+00:00 | 232.0 | 617.0 | 75.0 | 156.0 | -9.6 | 34.0 | 995.0 |
| 2024-03-01 00:01:00+00:00 | 235.0 | 621.0 | 76.0 | 156.0 | -9.6 | 34.0 | 995.0 |
| 2024-03-01 00:02:00+00:00 | 237.0 | 623.0 | 77.0 | 157.0 | -9.6 | 34.0 | 995.0 |
| 2024-03-01 00:03:00+00:00 | 240.0 | 627.0 | 77.0 | 157.0 | -9.5 | 35.0 | 995.0 |
| 2024-03-01 00:04:00+00:00 | 242.0 | 627.0 | 78.0 | 157.0 | -9.5 | 35.0 | 995.0 |
3. Solar geometry via BSRNDataset.solpos#
:meth:~bsrn.dataset.BSRNDataset.solpos adds zenith, bni_extra, ghi_extra, etc. to ds.data() (same frame as the radiation columns; needed before QC tests).
[3]:
# perform solar positioning using pydantic pipeline
ds.solpos()

# print the first 5 rows of the data, after solpos
ds.data().head()
[3]:
| ghi | bni | dhi | lwd | temp | rh | pressure | zenith | apparent_zenith | azimuth | bni_extra | ghi_extra | |
|---|---|---|---|---|---|---|---|---|---|---|---|---|
| 2024-03-01 00:00:00+00:00 | 232.0 | 617.0 | 75.0 | 156.0 | -9.6 | 34.0 | 995.0 | 75.486 | 75.424 | 119.062 | 1386.239 | 347.414 |
| 2024-03-01 00:01:00+00:00 | 235.0 | 621.0 | 76.0 | 156.0 | -9.6 | 34.0 | 995.0 | 75.339 | 75.278 | 119.269 | 1386.239 | 350.856 |
| 2024-03-01 00:02:00+00:00 | 237.0 | 623.0 | 77.0 | 157.0 | -9.6 | 34.0 | 995.0 | 75.192 | 75.132 | 119.476 | 1386.239 | 354.296 |
| 2024-03-01 00:03:00+00:00 | 240.0 | 627.0 | 77.0 | 157.0 | -9.5 | 35.0 | 995.0 | 75.046 | 74.986 | 119.683 | 1386.239 | 357.710 |
| 2024-03-01 00:04:00+00:00 | 242.0 | 627.0 | 78.0 | 157.0 | -9.5 | 35.0 | 995.0 | 74.900 | 74.841 | 119.890 | 1386.239 | 361.121 |
4. Clear-sky modeling via BSRNDataset.clear_sky#
:meth:~bsrn.dataset.BSRNDataset.clear_sky adds ghi_clear, bni_clear, dhi_clear columns to ds.data(). Default model is Ineichen; also supports 'mcclear', 'rest2', 'tj'. The next code cell uses 'rest2' as an example.
[4]:
# use REST2 model for clear-sky modeling
ds.clear_sky(model="rest2")

# print the first 5 rows of the data, after clear-sky modeling
ds.data().head()
Fetching MERRA-2 from Hugging Face: qiq/qiq0324_merra2.parquet
[4]:
| ghi | bni | dhi | lwd | temp | rh | pressure | zenith | apparent_zenith | azimuth | bni_extra | ghi_extra | ghi_clear | bni_clear | dhi_clear | lwd_clear | |
|---|---|---|---|---|---|---|---|---|---|---|---|---|---|---|---|---|
| 2024-03-01 00:00:00+00:00 | 232.0 | 617.0 | 75.0 | 156.0 | -9.6 | 34.0 | 995.0 | 75.486 | 75.424 | 119.062 | 1386.239 | 347.414 | 239.732694 | 679.617618 | 69.409265 | 163.369638 |
| 2024-03-01 00:01:00+00:00 | 235.0 | 621.0 | 76.0 | 156.0 | -9.6 | 34.0 | 995.0 | 75.339 | 75.278 | 119.269 | 1386.239 | 350.856 | 242.712901 | 682.923829 | 69.865229 | 163.369638 |
| 2024-03-01 00:02:00+00:00 | 237.0 | 623.0 | 77.0 | 157.0 | -9.6 | 34.0 | 995.0 | 75.192 | 75.132 | 119.476 | 1386.239 | 354.296 | 245.695984 | 686.192820 | 70.318309 | 163.369638 |
| 2024-03-01 00:03:00+00:00 | 240.0 | 627.0 | 77.0 | 157.0 | -9.5 | 35.0 | 995.0 | 75.046 | 74.986 | 119.683 | 1386.239 | 357.710 | 248.661515 | 689.403340 | 70.765487 | 164.472390 |
| 2024-03-01 00:04:00+00:00 | 242.0 | 627.0 | 78.0 | 157.0 | -9.5 | 35.0 | 995.0 | 74.900 | 74.841 | 119.890 | 1386.239 | 361.121 | 251.629675 | 692.578341 | 71.209894 | 164.472390 |
5. Part A — qc_test and tier row counts#
:meth:~bsrn.dataset.BSRNDataset.qc_test adds ``flag*`` columns on the cached :meth:~bsrn.dataset.BSRNDataset.data frame (in place). Count rows with ≥1 failure in each tier from those columns (1 = fail). Within a tier, a row is counted once if any flag in that tier is 1.
§7 builds the same tier-to-flag mapping in a ``TIER_COLS`` dict when comparing Part A vs Part B.
[5]:
# run all QC tests
ds.qc_test()

# print the first 5 rows of the data, after QC
ds.data().head()
[5]:
| ghi | bni | dhi | lwd | temp | rh | pressure | zenith | apparent_zenith | azimuth | ... | flagERLLWD | flag3lowSZA | flag3highSZA | flagKKt | flagKlowSZA | flagKhighSZA | flagKbKt | flagKb | flagKt | flagTracker | |
|---|---|---|---|---|---|---|---|---|---|---|---|---|---|---|---|---|---|---|---|---|---|
| 2024-03-01 00:00:00+00:00 | 232.0 | 617.0 | 75.0 | 156.0 | -9.6 | 34.0 | 995.0 | 75.486 | 75.424 | 119.062 | ... | 0 | 0 | 0 | 0 | 0 | 0 | 0 | 0 | 0 | 0 |
| 2024-03-01 00:01:00+00:00 | 235.0 | 621.0 | 76.0 | 156.0 | -9.6 | 34.0 | 995.0 | 75.339 | 75.278 | 119.269 | ... | 0 | 0 | 0 | 0 | 0 | 0 | 0 | 0 | 0 | 0 |
| 2024-03-01 00:02:00+00:00 | 237.0 | 623.0 | 77.0 | 157.0 | -9.6 | 34.0 | 995.0 | 75.192 | 75.132 | 119.476 | ... | 0 | 0 | 0 | 0 | 0 | 0 | 0 | 0 | 0 | 0 |
| 2024-03-01 00:03:00+00:00 | 240.0 | 627.0 | 77.0 | 157.0 | -9.5 | 35.0 | 995.0 | 75.046 | 74.986 | 119.683 | ... | 0 | 0 | 0 | 0 | 0 | 0 | 0 | 0 | 0 | 0 |
| 2024-03-01 00:04:00+00:00 | 242.0 | 627.0 | 78.0 | 157.0 | -9.5 | 35.0 | 995.0 | 74.900 | 74.841 | 119.890 | ... | 0 | 0 | 0 | 0 | 0 | 0 | 0 | 0 | 0 | 0 |
5 rows × 33 columns
6. Part B — Individual *_test functions#
Helpers: ``n_fail`` = rows where the test fails (i.e. pass is False). ``n_fail_any`` = rows where at least one of the given pass Series is False (unique rows within that list).
[6]:
import numpy as np
import pandas as pd
from bsrn.qc import closure, diff_ratio, erl, k_index, ppl, tracker

_qc = ds.data()


def n_fail(pass_bool):
    """Number of rows failing: *_test returns True=pass."""
    p = pass_bool if isinstance(pass_bool, pd.Series) else pd.Series(pass_bool, index=_qc.index)
    return int((~p.fillna(False)).sum())


def n_fail_any(*pass_series):
    """Rows where at least one test fails (unique rows; not sum of per-test counts)."""
    stacks = []
    for s in pass_series:
        p = s if isinstance(s, pd.Series) else pd.Series(s, index=_qc.index)
        stacks.append(p.fillna(False).to_numpy())
    all_pass = np.logical_and.reduce(stacks)
    return int((~all_pass).sum())
6.1 PPL (ppl.py)#
[7]:
pass_ghi = ppl.ghi_ppl_test(
    ghi = _qc.ghi,
    zenith = _qc.zenith,
    bni_extra = _qc.bni_extra
)
pass_bni = ppl.bni_ppl_test(
    bni = _qc.bni,
    bni_extra = _qc.bni_extra
)
pass_dhi = ppl.dhi_ppl_test(
    dhi = _qc.dhi,
    zenith = _qc.zenith,
    bni_extra = _qc.bni_extra
)
print("PPL GHI fail rows:", n_fail(pass_ghi))
print("PPL BNI fail rows:", n_fail(pass_bni))
print("PPL DHI fail rows:", n_fail(pass_dhi))
if "lwd" in ds.data().columns:
    pass_lwd = ppl.lwd_ppl_test(_qc.lwd)
    print("PPL LWD fail rows:", n_fail(pass_lwd))
else:
    pass_lwd = None
    print("PPL LWD: (no lwd column)")
_ppl = [pass_ghi, pass_bni, pass_dhi] + ([pass_lwd] if pass_lwd is not None else [])
print("PPL tier — rows failing ≥1 subtest (unique):", n_fail_any(*_ppl))
print("(Sum of the four counts above can exceed this if the same row fails multiple PPL tests.)")
PPL GHI fail rows: 7947
PPL BNI fail rows: 6
PPL DHI fail rows: 9685
PPL LWD fail rows: 8
PPL tier — rows failing ≥1 subtest (unique): 10592
(Sum of the four counts above can exceed this if the same row fails multiple PPL tests.)
6.2 ERL (erl.py)#
[8]:
e_ghi = erl.ghi_erl_test(
    ghi = _qc.ghi,
    zenith = _qc.zenith,
    bni_extra = _qc.bni_extra
)
e_bni = erl.bni_erl_test(
    bni = _qc.bni,
    zenith = _qc.zenith,
    bni_extra = _qc.bni_extra)
e_dhi = erl.dhi_erl_test(
    dhi = _qc.dhi,
    zenith = _qc.zenith,
    bni_extra = _qc.bni_extra
)
print("ERL GHI fail rows:", n_fail(e_ghi))
print("ERL BNI fail rows:", n_fail(e_bni))
print("ERL DHI fail rows:", n_fail(e_dhi))
if "lwd" in ds.data().columns:
    e_lwd = erl.lwd_erl_test(_qc.lwd)
    print("ERL LWD fail rows:", n_fail(e_lwd))
else:
    e_lwd = None
_erl = [e_ghi, e_bni, e_dhi] + ([e_lwd] if e_lwd is not None else [])
print("ERL tier — rows failing ≥1 subtest (unique):", n_fail_any(*_erl))
ERL GHI fail rows: 18318
ERL BNI fail rows: 13
ERL DHI fail rows: 19271
ERL LWD fail rows: 8
ERL tier — rows failing ≥1 subtest (unique): 19353
6.3 Closure (closure.py)#
[9]:
c_low = closure.closure_low_sza_test(
    ghi = _qc.ghi,
    bni = _qc.bni,
    dhi = _qc.dhi,
    zenith = _qc.zenith
)
c_high = closure.closure_high_sza_test(
    ghi = _qc.ghi,
    bni = _qc.bni,
    dhi = _qc.dhi,
    zenith = _qc.zenith
)
print("Closure low-SZA  fail rows:", n_fail(c_low))
print("Closure high-SZA fail rows:", n_fail(c_high))
print("Closure tier — rows failing ≥1 subtest (unique):", n_fail_any(c_low, c_high))
Closure low-SZA  fail rows: 11
Closure high-SZA fail rows: 18
Closure tier — rows failing ≥1 subtest (unique): 29
6.4 Diffuse ratio (diff_ratio.py)#
[10]:
d_kkt = diff_ratio.k_kt_combined_test(
    ghi = _qc.ghi,
    dhi = _qc.dhi,
    bni_extra = _qc.bni_extra,
    zenith = _qc.zenith
)
d_klo = diff_ratio.k_low_sza_test(
    ghi = _qc.ghi,
    dhi = _qc.dhi,
    zenith = _qc.zenith
)
d_khi = diff_ratio.k_high_sza_test(
    ghi = _qc.ghi,
    dhi = _qc.dhi,
    zenith = _qc.zenith
)
print("K–Kt combined fail rows:", n_fail(d_kkt))
print("k low-SZA       fail rows:", n_fail(d_klo))
print("k high-SZA      fail rows:", n_fail(d_khi))
print("Diffuse-ratio tier — rows failing ≥1 subtest (unique):", n_fail_any(d_kkt, d_klo, d_khi))
K–Kt combined fail rows: 20
k low-SZA       fail rows: 1
k high-SZA      fail rows: 0
Diffuse-ratio tier — rows failing ≥1 subtest (unique): 20
6.5 K-indices (k_index.py)#
[11]:
k_kbkt = k_index.kb_kt_test(
    ghi = _qc.ghi,
    bni = _qc.bni,
    bni_extra = _qc.bni_extra,
    zenith = _qc.zenith
)
k_kb = k_index.kb_limit_test(
    bni = _qc.bni,
    bni_extra = _qc.bni_extra,
    elevation = ds.elev,
    ghi = _qc.ghi
)
k_kt = k_index.kt_limit_test(
    ghi = _qc.ghi,
    bni_extra = _qc.bni_extra,
    zenith = _qc.zenith
)
print("Kb vs Kt fail rows:", n_fail(k_kbkt))
print("Kb limit   fail rows:", n_fail(k_kb))
print("Kt limit   fail rows:", n_fail(k_kt))
print("K-index tier — rows failing ≥1 subtest (unique):", n_fail_any(k_kbkt, k_kb, k_kt))
Kb vs Kt fail rows: 0
Kb limit   fail rows: 0
Kt limit   fail rows: 0
K-index tier — rows failing ≥1 subtest (unique): 0
6.6 Tracker (tracker.py)#
[12]:
pass_trk = tracker.tracker_off_test(
    ghi = _qc.ghi,
    bni = _qc.bni,
    zenith = _qc.zenith,
    ghi_extra = _qc.ghi_extra,
    ghi_clear = _qc.ghi_clear,
    bni_clear = _qc.bni_clear
)
print("Tracker-off fail rows:", n_fail(pass_trk))
Tracker-off fail rows: 351
7. Compare Part A vs Part B (per tier)#
Part A uses ``qc_test`` flag* columns (tier groupings as in §5). Part B uses raw *_test pass/fail booleans and ``n_fail_any`` (tier unique fail rows from §6), including ``pass_trk`` from §6.6. Run §5 (so flag* exist), then §6 through §6.6, before this cell. Counts should match for each tier.
[13]:
TIER_COLS = {
    "PPL": [c for c in _qc.columns if c.startswith("flagPPL")],
    "ERL": [c for c in _qc.columns if c.startswith("flagERL")],
    "Closure": [c for c in _qc.columns if c.startswith("flag3")],
    "Diffuse k / K–Kt": ["flagKKt", "flagKlowSZA", "flagKhighSZA"],
    "K-indices": ["flagKbKt", "flagKb", "flagKt"],
    "Tracker": ["flagTracker"],
}
part_a_tier = {}
for name, want in TIER_COLS.items():
    cols = [c for c in want if c in _qc.columns]
    if cols:
        part_a_tier[name] = int(_qc[cols].eq(1).any(axis=1).sum())

part_b_tier = {
    "PPL": n_fail_any(*_ppl),
    "ERL": n_fail_any(*_erl),
    "Closure": n_fail_any(c_low, c_high),
    "Diffuse k / K–Kt": n_fail_any(d_kkt, d_klo, d_khi),
    "K-indices": n_fail_any(k_kbkt, k_kb, k_kt),
    "Tracker": n_fail(pass_trk),
}

cmp = pd.DataFrame(
    {
        "Part A (qc_test flag*, any fail in tier)": pd.Series(part_a_tier),
        "Part B (raw *_test, tier unique fails)": pd.Series(part_b_tier),
    }
)
cmp["match"] = cmp.iloc[:, 0] == cmp.iloc[:, 1]
cmp
[13]:
| Part A (qc_test flag*, any fail in tier) | Part B (raw *_test, tier unique fails) | match | |
|---|---|---|---|
| PPL | 10592 | 10592 | True |
| ERL | 19353 | 19353 | True |
| Closure | 29 | 29 | True |
| Diffuse k / K–Kt | 20 | 20 | True |
| K-indices | 0 | 0 | True |
| Tracker | 351 | 351 | True |
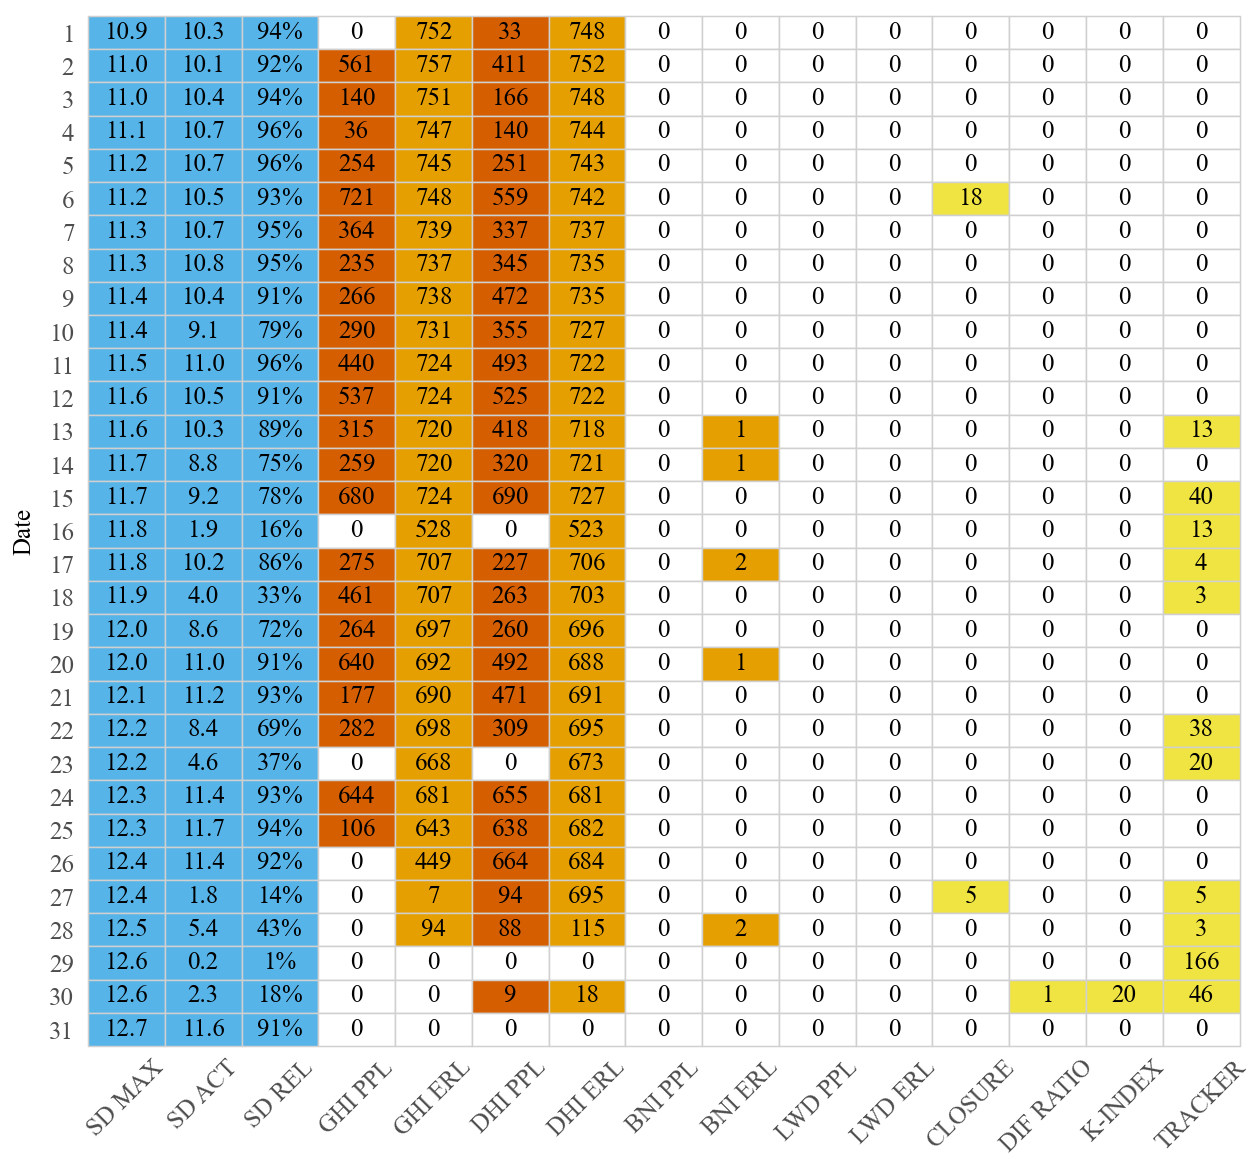
8. Daily QC audit table#
``ds.plot.table()`` (via :attr:~bsrn.dataset.BSRNDataset.plot) calls ``get_daily_stats`` on ds.data() then ``plot_qc_table``: one row per calendar day with sunshine-duration metrics (SD), per-component PPL / ERL failure minute counts, and composite rows (closure, diffuse ratio, K-index, tracker). The figure is a heatmap-style table (Wong palette: passes white, stats sky blue, tier failures by level).
[14]:
ds.plot.table()
[14]:
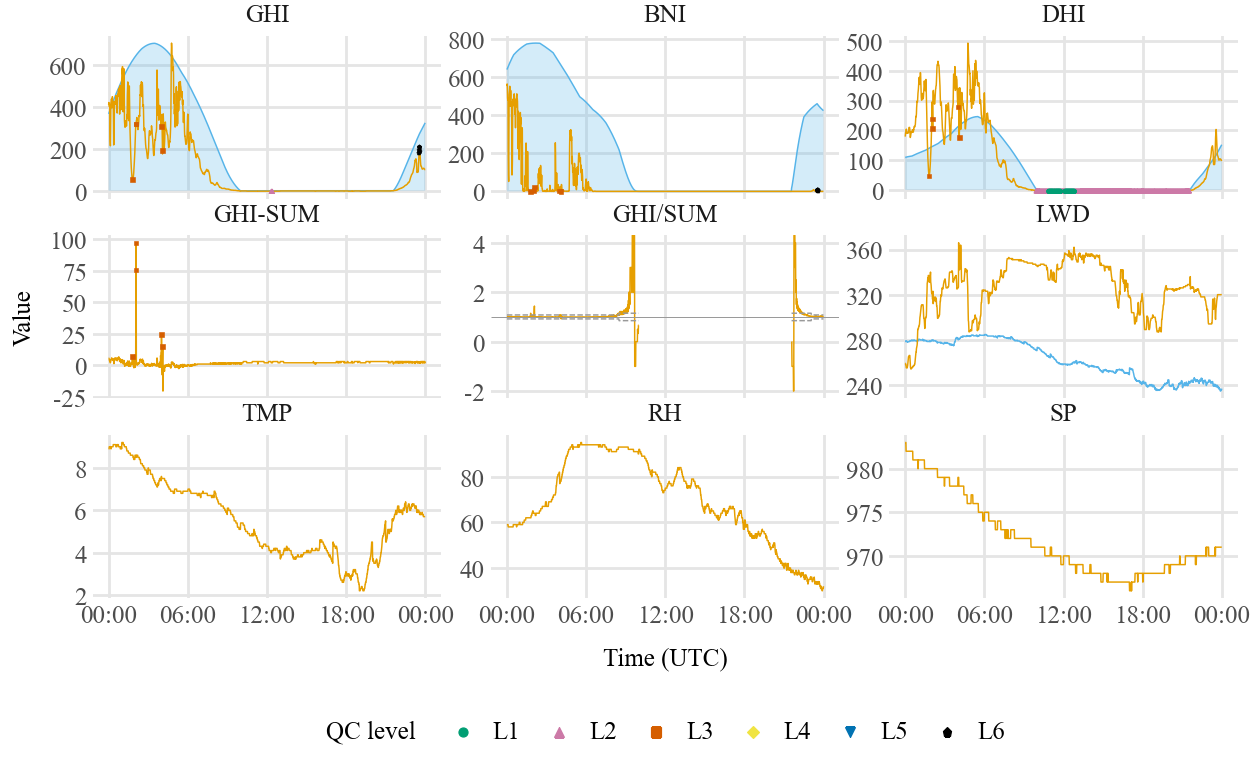
9. Faceted timeseries for 27 March (UTC)#
Run before §10: this uses ds.data() while QC ``flag*`` columns are still present (after §5 / §8). Section §10 applies :meth:~bsrn.dataset.BSRNDataset.qc_mask, which NaNs failed irradiance and drops those flags.
``ds.plot.daily(…)`` (via :attr:~bsrn.dataset.BSRNDataset.plot) calls :func:~bsrn.visualization.daily.plot_bsrn_daily_day with df=ds.data(): 3×3 facets for one UTC calendar day. The frame must already include zenith and apparent_zenith (after solpos()). Clear-sky curves appear only when the matching *_clear columns exist (e.g. after clear_sky()). Level 1–6 QC markers (Wong colours) use existing flag* columns only (e.g. after
qc_test()); the plot module does not run run_qc, add_clearsky_columns, or PPL tests. Low-level API: bsrn.visualization.daily.plot_bsrn_daily_day.
March 27 is the day highlighted elsewhere for tracker issues; adjust ``DAY_UTC`` to explore other days.
[15]:
DAY_UTC = "2024-03-27"

# plot_bsrn_daily_day(DAY_UTC, df=ds.data())
ds.plot.daily(DAY_UTC)

# Optional: output_file="qiq_2024-03-27.pdf", title="...", show_qc_markers=True
/Volumes/Macintosh Research/Data/bsrn-qc/src/bsrn/visualization/daily.py:187: UserWarning: Converting to PeriodArray/Index representation will drop timezone information.
[15]:
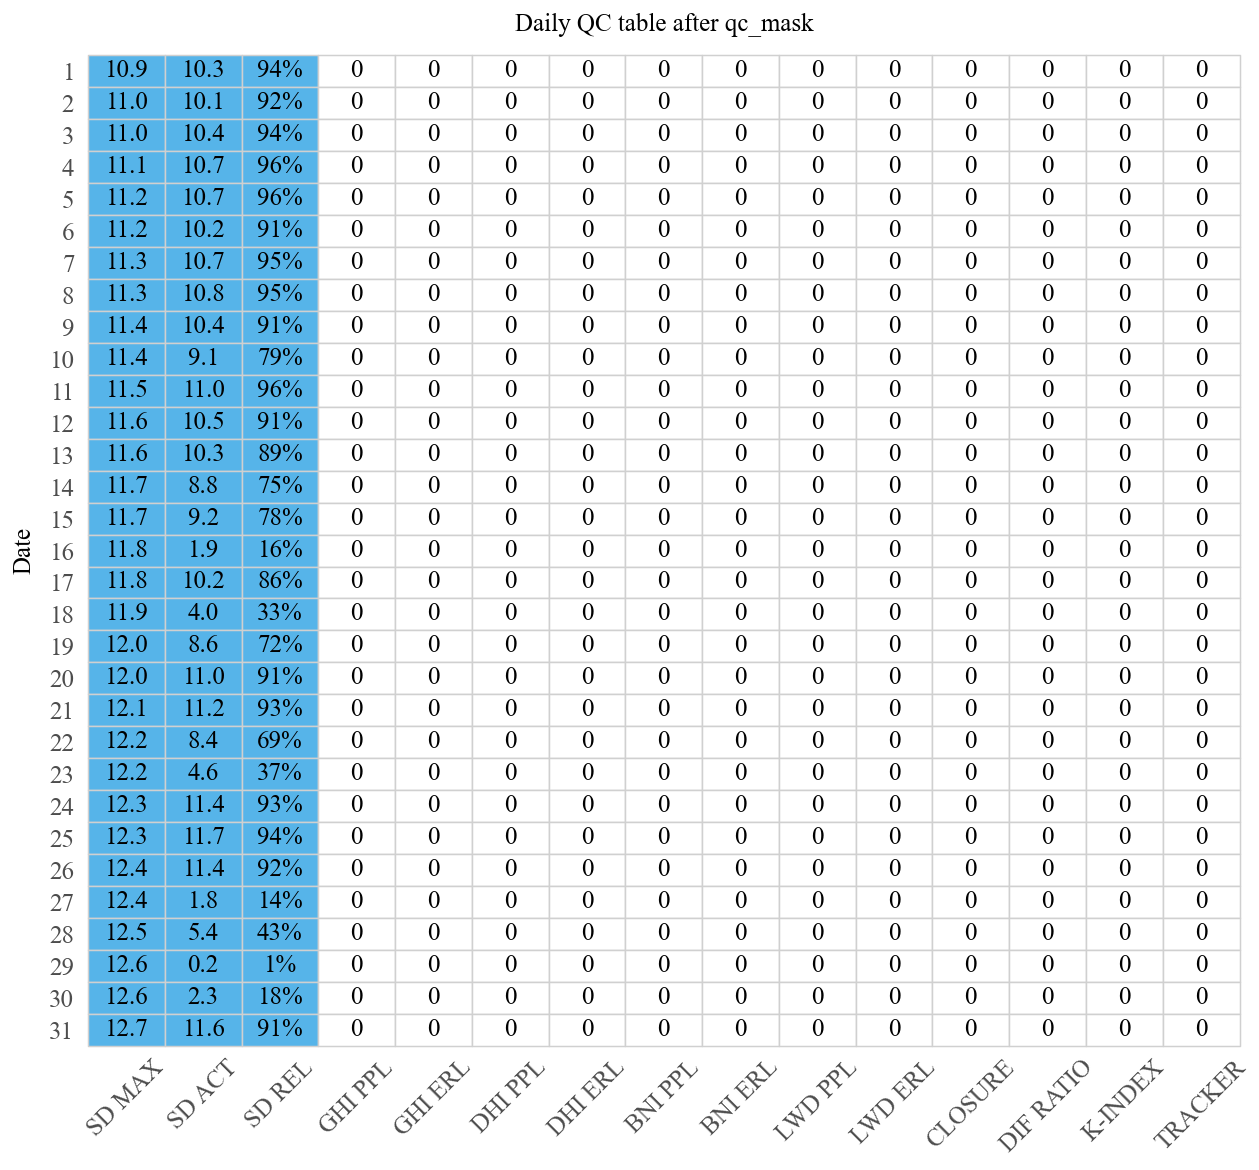
10. Apply qc_mask and refresh the audit table#
:meth:~bsrn.dataset.BSRNDataset.qc_mask calls :func:~bsrn.qc.wrapper.mask_failed_irradiance on the cached :meth:~bsrn.dataset.BSRNDataset.data frame: minutes that fail the usual ``flag*`` rules get NaN in the corresponding irradiance columns, and (with the default flag_remove=True) those standard flag columns are removed. After §8 (first audit table) and §9 (faceted day plot, while ``flag*`` columns and raw irradiance are still present), run
``qc_mask()`` and ``ds.plot.table()`` again: it still uses :func:~bsrn.utils.quality.get_daily_stats, which recomputes daily failure tallies from the current minute series, so the heatmap updates to reflect the masked data.
[16]:
ds.qc_mask()
ds.plot.table(title="Daily QC table after qc_mask")
[16]: