Clear Sky Detection Demo With McClear#
This notebook demonstrates the McClear-based workflow in the bsrn package, including data reading, clear-sky modeling, quality control tests, Reno clear-sky detection, and CSD-point visualization.
1. Import libraries#
[1]:
import os
import random
import pandas as pd
import bsrn

# Config: input file (same pattern as cloud_enhancement_events_detection.ipynb)
INPUT_FILE = "/Volumes/Macintosh Research/Data/bsrn-qc/data/QIQ/qiq0924.dat.gz"

# Set display options
pd.options.display.max_columns = None
%matplotlib inline
2. Load QIQ September data#
[2]:
# Extract station code from filename (e.g. qiq0924.dat.gz -> QIQ)
stn = os.path.basename(INPUT_FILE).split(".")[0][:3].upper()

if os.path.exists(INPUT_FILE):
    df = bsrn.io.reader.read_station_to_archive(INPUT_FILE, logical_records="lr0100")
    print(f"Data for {stn} loaded successfully (September 2024).")
    display(df.head())
else:
    raise FileNotFoundError(f"File not found: {INPUT_FILE}. Current working directory: {os.getcwd()}")
Data for QIQ loaded successfully (September 2024).
| ghi | bni | dhi | lwd | temp | rh | pressure | |
|---|---|---|---|---|---|---|---|
| time | |||||||
| 2024-09-01 00:00:00+00:00 | 142.0 | 0.0 | 143.0 | 371.0 | 22.1 | 48.0 | 988.0 |
| 2024-09-01 00:01:00+00:00 | 141.0 | 0.0 | 141.0 | 371.0 | 22.2 | 49.0 | 988.0 |
| 2024-09-01 00:02:00+00:00 | 139.0 | 0.0 | 140.0 | 371.0 | 22.2 | 46.0 | 988.0 |
| 2024-09-01 00:03:00+00:00 | 139.0 | 0.0 | 139.0 | 371.0 | 22.2 | 45.0 | 988.0 |
| 2024-09-01 00:04:00+00:00 | 137.0 | 0.0 | 138.0 | 371.0 | 22.1 | 48.0 | 988.0 |
3. Clear-sky modeling with McClear#
[4]:
# TODO: replace with your real SoDa / McClear email
mcclear_email = "your_email@example.com"

df_cs = bsrn.modeling.clear_sky.add_clearsky_columns(
    df.copy(),
    station_code=stn,
    model="mcclear",
    mcclear_email=mcclear_email,
)

display(df_cs[["ghi", "ghi_clear", "bni", "bni_clear", "dhi", "dhi_clear"]].head())
| ghi | ghi_clear | bni | bni_clear | dhi | dhi_clear | |
|---|---|---|---|---|---|---|
| time | ||||||
| 2024-09-01 00:00:00+00:00 | 142.0 | NaN | 0.0 | NaN | 143.0 | NaN |
| 2024-09-01 00:01:00+00:00 | 141.0 | 446.412 | 0.0 | 687.102 | 141.0 | 114.546 |
| 2024-09-01 00:02:00+00:00 | 139.0 | 449.172 | 0.0 | 688.938 | 140.0 | 114.780 |
| 2024-09-01 00:03:00+00:00 | 139.0 | 451.926 | 0.0 | 690.756 | 139.0 | 115.008 |
| 2024-09-01 00:04:00+00:00 | 137.0 | 454.668 | 0.0 | 692.556 | 138.0 | 115.236 |
4. Run QC wrapper#
run_qc runs a suite of BSRN quality control tests and adds flag columns (0 = pass, 1 = fail). By default it runs all six test groups:
Test |
Level |
Description |
Flag columns |
|---|---|---|---|
ppl |
1 |
Physically Possible Limits — absolute bounds for GHI, BNI, DHI, LWD |
flagPPLGHI, flagPPLBNI, flagPPLDHI, flagPPLLWD |
erl |
2 |
Extremely Rare Limits — climatological limits for GHI, BNI, DHI, LWD |
flagERLGHI, flagERLBNI, flagERLDHI, flagERLLWD |
closure |
3 |
Closure — \(G_h\) vs \(B_n \cos Z + D_h\) at low/high zenith |
flag3lowSZA, flag3highSZA |
diff_ratio |
4 |
Diffuse ratio — \(k\)–\(k_t\) and diffuse-fraction checks |
flagKKt, flagKlowSZA, flagKhighSZA |
k_index |
5 |
K-indices — \(k_b\)/\(k_t\) and clearness-index limits |
flagKbKt, flagKb, flagKt |
tracker |
6 |
Tracker-off — detects tracking errors using clear-sky/extra references |
flagTracker |
You can restrict tests via tests=('ppl', 'closure') etc.
[5]:
df_qc = bsrn.qc.run_qc(df_cs.copy(), station_code=stn)

flag_cols = [c for c in df_qc.columns if c.startswith("flag")]
print("QC flag counts (non-zero indicates failure):")
display(df_qc[flag_cols].sum())
QC flag counts (non-zero indicates failure):
flagPPLGHI          0
flagPPLBNI          0
flagPPLDHI          0
flagPPLLWD          0
flagERLGHI      16408
flagERLBNI          3
flagERLDHI      15498
flagERLLWD          0
flag3lowSZA         0
flag3highSZA        0
flagKKt             0
flagKlowSZA         0
flagKhighSZA        0
flagKbKt            0
flagKb              0
flagKt              0
flagTracker       100
dtype: int64
5. Reno clear-sky detection#
[6]:
ghi = df_qc["ghi"].values
ghi_clear = df_qc["ghi_clear"].values
times = df_qc.index

reno_out = bsrn.utils.reno_csd(ghi, ghi_clear, times=times, return_diagnostics=False)

df_csd = df_qc.copy()
df_csd["is_clearsky_reno"] = reno_out["is_clearsky"]
df_csd["cloud_flag_reno"] = reno_out["cloud_flag"]

display(df_csd[["ghi", "ghi_clear", "is_clearsky_reno", "cloud_flag_reno"]].head())
| ghi | ghi_clear | is_clearsky_reno | cloud_flag_reno | |
|---|---|---|---|---|
| time | ||||
| 2024-09-01 00:00:00+00:00 | 142.0 | NaN | <NA> | NaN |
| 2024-09-01 00:01:00+00:00 | 141.0 | 446.412 | False | 1.0 |
| 2024-09-01 00:02:00+00:00 | 139.0 | 449.172 | False | 1.0 |
| 2024-09-01 00:03:00+00:00 | 139.0 | 451.926 | False | 1.0 |
| 2024-09-01 00:04:00+00:00 | 137.0 | 454.668 | False | 1.0 |
6. Choose a random Reno clear-sky day#
[7]:
cs = df_csd["is_clearsky_reno"]
cs_days = cs[cs == True].index.normalize().unique()

if len(cs_days) == 0:
    raise RuntimeError("No clear-sky points found by Reno in this month.")

random_day = random.choice(list(cs_days))
print(f"Random clear-sky day (Reno): {random_day}")

day_slice = df_csd.loc[str(random_day.date())]
display(day_slice[["ghi", "ghi_clear", "is_clearsky_reno"]].head())
Random clear-sky day (Reno): 2024-09-25 00:00:00+00:00
| ghi | ghi_clear | is_clearsky_reno | |
|---|---|---|---|
| time | |||
| 2024-09-25 00:00:00+00:00 | 313.0 | 334.836 | False |
| 2024-09-25 00:01:00+00:00 | 315.0 | 337.548 | False |
| 2024-09-25 00:02:00+00:00 | 323.0 | 340.314 | False |
| 2024-09-25 00:03:00+00:00 | 326.0 | 343.074 | False |
| 2024-09-25 00:04:00+00:00 | 327.0 | 345.834 | False |
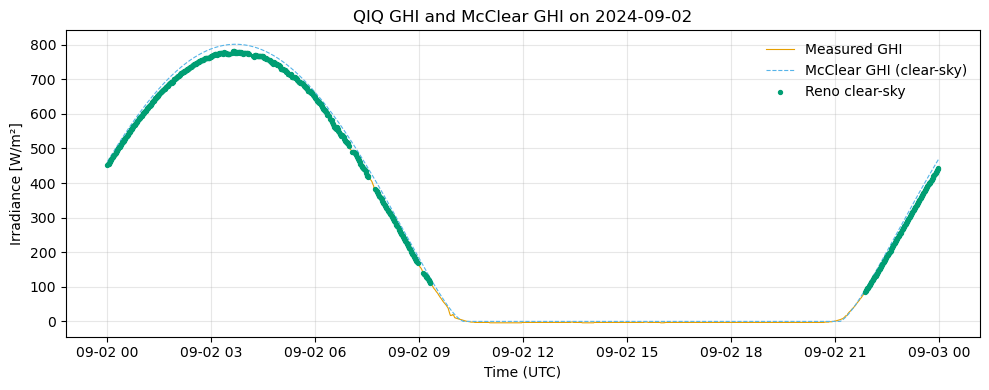
7. Plot September 2 with Reno clear-sky points#
[8]:
import matplotlib.pyplot as plt

# Choose a specific day in September
sep2_str = "2024-09-02"
if sep2_str not in df_csd.index.strftime("%Y-%m-%d").unique():
    raise ValueError(f"No data found for {sep2_str} in df_csd.")

sep2 = df_csd.loc[sep2_str]

plt.figure(figsize=(10, 4))
plt.plot(sep2.index, sep2["ghi"], label="Measured GHI", color="#E69F00", linewidth=0.8)
plt.plot(sep2.index, sep2["ghi_clear"], label="McClear GHI (clear-sky)", color="#56B4E9", linestyle="--", linewidth=0.8)

# Highlight Reno clear-sky points
if "is_clearsky_reno" in sep2.columns:
    cs_mask = sep2["is_clearsky_reno"] == True
    if cs_mask.any():
        plt.scatter(
            sep2.index[cs_mask],
            sep2["ghi"][cs_mask],
            s=8,
            color="#009E73",
            label="Reno clear-sky",
            zorder=5,
        )

plt.title(f"{stn} GHI and McClear GHI on {sep2_str}")
plt.ylabel("Irradiance [W/m²]")
plt.xlabel("Time (UTC)")
plt.legend(frameon=False)
plt.grid(alpha=0.3)
plt.tight_layout()
plt.show()