Cloud Enhancement Event Detection with REST2#
REST2 clear-sky modeling, QC (closure, diffuse ratio, tracker-off), and Killinger cloud enhancement event (CEE) detection.
Assumes the bsrn package is installed via pip.
1. Setup#
[1]:
import os
import sys
import pandas as pd
import bsrn

# Config: input file, output path. REST2 fetches MERRA-2 from Hugging Face (dazhiyang/bsrn-merra2) into RAM.
INPUT_FILE = "/Volumes/Macintosh Research/Data/bsrn-qc/data/QIQ/qiq0124.dat.gz"
OUTPUT_FILE = "qiq_cee_results.csv"
2. Read QIQ data#
[2]:
df = bsrn.io.reader.read_station_to_archive(INPUT_FILE, logical_records="lr0100")
if df is None:
    raise SystemExit(f"Failed to read {INPUT_FILE}")
df.head()
[2]:
| ghi | bni | dhi | lwd | temp | rh | pressure | |
|---|---|---|---|---|---|---|---|
| time | |||||||
| 2024-01-01 00:00:00+00:00 | 33.0 | 72.0 | 28.0 | 189.0 | -12.1 | 74.0 | 995.0 |
| 2024-01-01 00:01:00+00:00 | 36.0 | 83.0 | 29.0 | 189.0 | -12.2 | 73.0 | 995.0 |
| 2024-01-01 00:02:00+00:00 | 39.0 | 102.0 | 31.0 | 189.0 | -12.2 | 73.0 | 995.0 |
| 2024-01-01 00:03:00+00:00 | 40.0 | 100.0 | 32.0 | 189.0 | -12.3 | 73.0 | 995.0 |
| 2024-01-01 00:04:00+00:00 | 40.0 | 83.0 | 34.0 | 189.0 | -12.3 | 74.0 | 995.0 |
3. REST2 clear-sky modeling#
MERRA-2 parquet is fetched from Hugging Face into RAM (no disk cache). You will see Fetching MERRA-2 from Hugging Face: qiq/qiq0124_merra2.parquet when this cell runs.
[3]:
df = bsrn.modeling.clear_sky.add_clearsky_columns(
    df, station_code="QIQ", model="rest2"
)
from bsrn.constants import BSRN_STATIONS
from bsrn.physics.geometry import get_solar_position

meta = BSRN_STATIONS["QIQ"]
solpos = get_solar_position(
    df.index, lat=meta["lat"], lon=meta["lon"], elev=meta["elev"]
)
df["zenith"] = solpos["zenith"].to_numpy(dtype=float)
df[["ghi", "ghi_clear", "bni", "bni_clear", "dhi", "dhi_clear"]].head()
Fetching MERRA-2 from Hugging Face: qiq/qiq0124_merra2.parquet
[3]:
| ghi | ghi_clear | bni | bni_clear | dhi | dhi_clear | |
|---|---|---|---|---|---|---|
| time | ||||||
| 2024-01-01 00:00:00+00:00 | 33.0 | 29.556179 | 72.0 | 159.759526 | 28.0 | 21.102296 |
| 2024-01-01 00:01:00+00:00 | 36.0 | 31.165183 | 83.0 | 166.959123 | 29.0 | 21.956312 |
| 2024-01-01 00:02:00+00:00 | 39.0 | 32.792222 | 102.0 | 174.103865 | 31.0 | 22.800400 |
| 2024-01-01 00:03:00+00:00 | 40.0 | 34.436816 | 100.0 | 181.189548 | 32.0 | 23.634844 |
| 2024-01-01 00:04:00+00:00 | 40.0 | 36.098472 | 83.0 | 188.212621 | 34.0 | 24.459916 |
4. QC: closure, diffuse ratio, tracker-off#
Why PPL and ERL are not used: Level 1 (PPL) and Level 2 (ERL) QC tests apply physicallt possible and extremely rare bounds that may filter out valid CEE data. CEEs are characterized by GHI exceeding clear-sky or extraterrestrial irradiance—values that PPL/ERL can flag as outliers. This pipeline uses closure, diffuse ratio, and tracker-off checks instead, which are less likely to remove CEE events.
[4]:
df = bsrn.qc.wrapper.run_qc(
    df,
    station_code="QIQ",
    tests=("closure", "diff_ratio", "tracker"),
)
df[[c for c in df.columns if c.startswith("flag")]].head()
[4]:
| flag3lowSZA | flag3highSZA | flagKKt | flagKlowSZA | flagKhighSZA | flagTracker | |
|---|---|---|---|---|---|---|
| time | ||||||
| 2024-01-01 00:00:00+00:00 | 0 | 0 | 0 | 0 | 0 | 0 |
| 2024-01-01 00:01:00+00:00 | 0 | 0 | 0 | 0 | 0 | 0 |
| 2024-01-01 00:02:00+00:00 | 0 | 0 | 0 | 0 | 0 | 0 |
| 2024-01-01 00:03:00+00:00 | 0 | 0 | 0 | 0 | 0 | 0 |
| 2024-01-01 00:04:00+00:00 | 0 | 0 | 0 | 0 | 0 | 0 |
5. Row-wise: mask ghi, dhi, bni to NaN where any QC fails#
[5]:
qc_flags = [
    "flag3lowSZA", "flag3highSZA",
    "flagKKt", "flagKlowSZA", "flagKhighSZA",
    "flagTracker",
]
fail_mask = pd.Series(False, index=df.index)
for col in qc_flags:
    if col in df.columns:
        fail_mask = fail_mask | (df[col] == 1)

for col in ("ghi", "dhi", "bni"):
    if col in df.columns:
        df.loc[fail_mask, col] = float("nan")

print(f"Rows masked: {fail_mask.sum()}")
Rows masked: 347
6. Drop unused columns; keep measured + clear-sky#
[6]:
keep = ["ghi", "bni", "dhi", "zenith", "ghi_clear", "bni_clear", "dhi_clear"]
df = df[[c for c in keep if c in df.columns]].copy()
df.head()
[6]:
| ghi | bni | dhi | zenith | ghi_clear | bni_clear | dhi_clear | |
|---|---|---|---|---|---|---|---|
| time | |||||||
| 2024-01-01 00:00:00+00:00 | 33.0 | 72.0 | 28.0 | 86.966703 | 29.556179 | 159.759526 | 21.102296 |
| 2024-01-01 00:01:00+00:00 | 36.0 | 83.0 | 29.0 | 86.838164 | 31.165183 | 166.959123 | 21.956312 |
| 2024-01-01 00:02:00+00:00 | 39.0 | 102.0 | 31.0 | 86.709987 | 32.792222 | 174.103865 | 22.800400 |
| 2024-01-01 00:03:00+00:00 | 40.0 | 100.0 | 32.0 | 86.582173 | 34.436816 | 181.189548 | 23.634844 |
| 2024-01-01 00:04:00+00:00 | 40.0 | 83.0 | 34.0 | 86.454723 | 36.098472 | 188.212621 | 24.459916 |
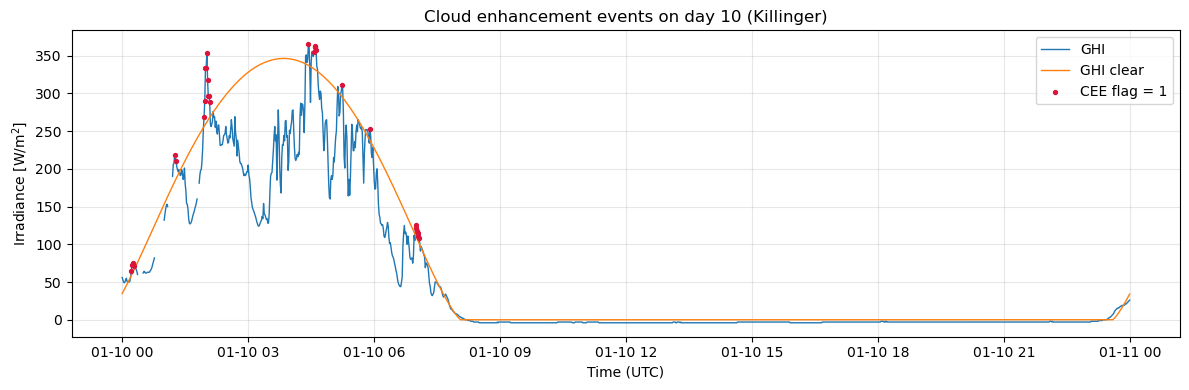
7. Killinger CEE detection#
[7]:
out_cee = bsrn.utils.cee_detection.detect_cee(
    "killinger",
    ghi=df["ghi"],
    ghi_clear=df["ghi_clear"],
    zenith=df["zenith"],
    times=df.index,
)
df["cee_flag"] = out_cee["cee_flag"].values

# Count CEEs: 1-min points flagged, and distinct events (contiguous runs)
cee_flag = out_cee["cee_flag"]
n_cee_points = (cee_flag == 1).sum()
# Count event starts: transition from non-CEE to CEE
starts = (cee_flag == 1) & (cee_flag.shift(1, fill_value=0) != 1)
n_cee_events = int(starts.sum())
print(f"CEE count: {n_cee_points} 1-min points in {n_cee_events} distinct events")

out_cee.head()
CEE count: 259 1-min points in 54 distinct events
[7]:
| is_enhancement | cee_flag | method | |
|---|---|---|---|
| time | |||
| 2024-01-01 00:00:00+00:00 | <NA> | NaN | killinger |
| 2024-01-01 00:01:00+00:00 | <NA> | NaN | killinger |
| 2024-01-01 00:02:00+00:00 | <NA> | NaN | killinger |
| 2024-01-01 00:03:00+00:00 | <NA> | NaN | killinger |
| 2024-01-01 00:04:00+00:00 | <NA> | NaN | killinger |
8. Plot CEE results#
[10]:
import matplotlib.pyplot as plt

plot_df = df[["ghi", "ghi_clear", "cee_flag"]].copy()
plot_df = plot_df[plot_df.index.day == 10]
if plot_df.empty:
    raise ValueError("No data for day 10 in current dataframe.")
mask = plot_df["cee_flag"] == 1

fig, ax = plt.subplots(figsize=(12, 4))
ax.plot(plot_df.index, plot_df["ghi"], label="GHI", linewidth=1.0)
ax.plot(plot_df.index, plot_df["ghi_clear"], label="GHI clear", linewidth=1.0)
ax.scatter(
    plot_df.index[mask],
    plot_df.loc[mask, "ghi"],
    s=8,
    color="crimson",
    label="CEE flag = 1",
    zorder=3,
)
ax.set_title("Cloud enhancement events on day 10 (Killinger)")
ax.set_xlabel("Time (UTC)")
ax.set_ylabel("Irradiance [W/m$^2$]")
ax.legend(loc="upper right")
ax.grid(alpha=0.3)
fig.tight_layout()
plt.show()